There is often no straightforward explanation for the various types of violence that occur around the world. In fact, even when using clear definitions (such as “Civil War,” “Invasion,” or “Local Uprisings”), these labels imply certain assumptions regarding their causes as well as their eventual outcomes.
A recent article published in the journal Royal Society Open Science by a group of researchers from the Complexity Science Hub in Vienna, who partnered with the University of Waterloo and Princeton University, takes a new approach. Researchers are using machine learning techniques to classify conflicts based on the manner in which they develop and continue throughout time. This study found that while there are a few distinct patterns in which these conflicts form and continue over time, these same patterns provide little to no insight into what level of violence or how much time will be needed before that violence occurs.
According to Niraj Kushwaha, the lead author of this study at the Complexity Science Hub, “When we think of ‘Civil War,’ we often think of it being an internal conflict,” and he also noted that there is ongoing debate about whether the terms “Invasion” or “Defensive Wars” should be used when referring to certain types of conflict as well. Similarly, conflict experts will also assign labels to different types of conflict to indicate significant characteristics and to allow for the categorization of conflict for the purposes of systematic analysis and decision-making related to early warning systems and public policy.
Eddie Lee, who is also at the Complexity Science Hub, further explained that the labels that current conflict classifications use are created through expert judgment and are based on personal opinions. According to Lee, “Current conflict classifications are mostly heuristic in nature; this means the classifications are solely based on heuristics (rules of thumb) and expert judgment, which may differ from one expert to another and may therefore not be easily replicated.”
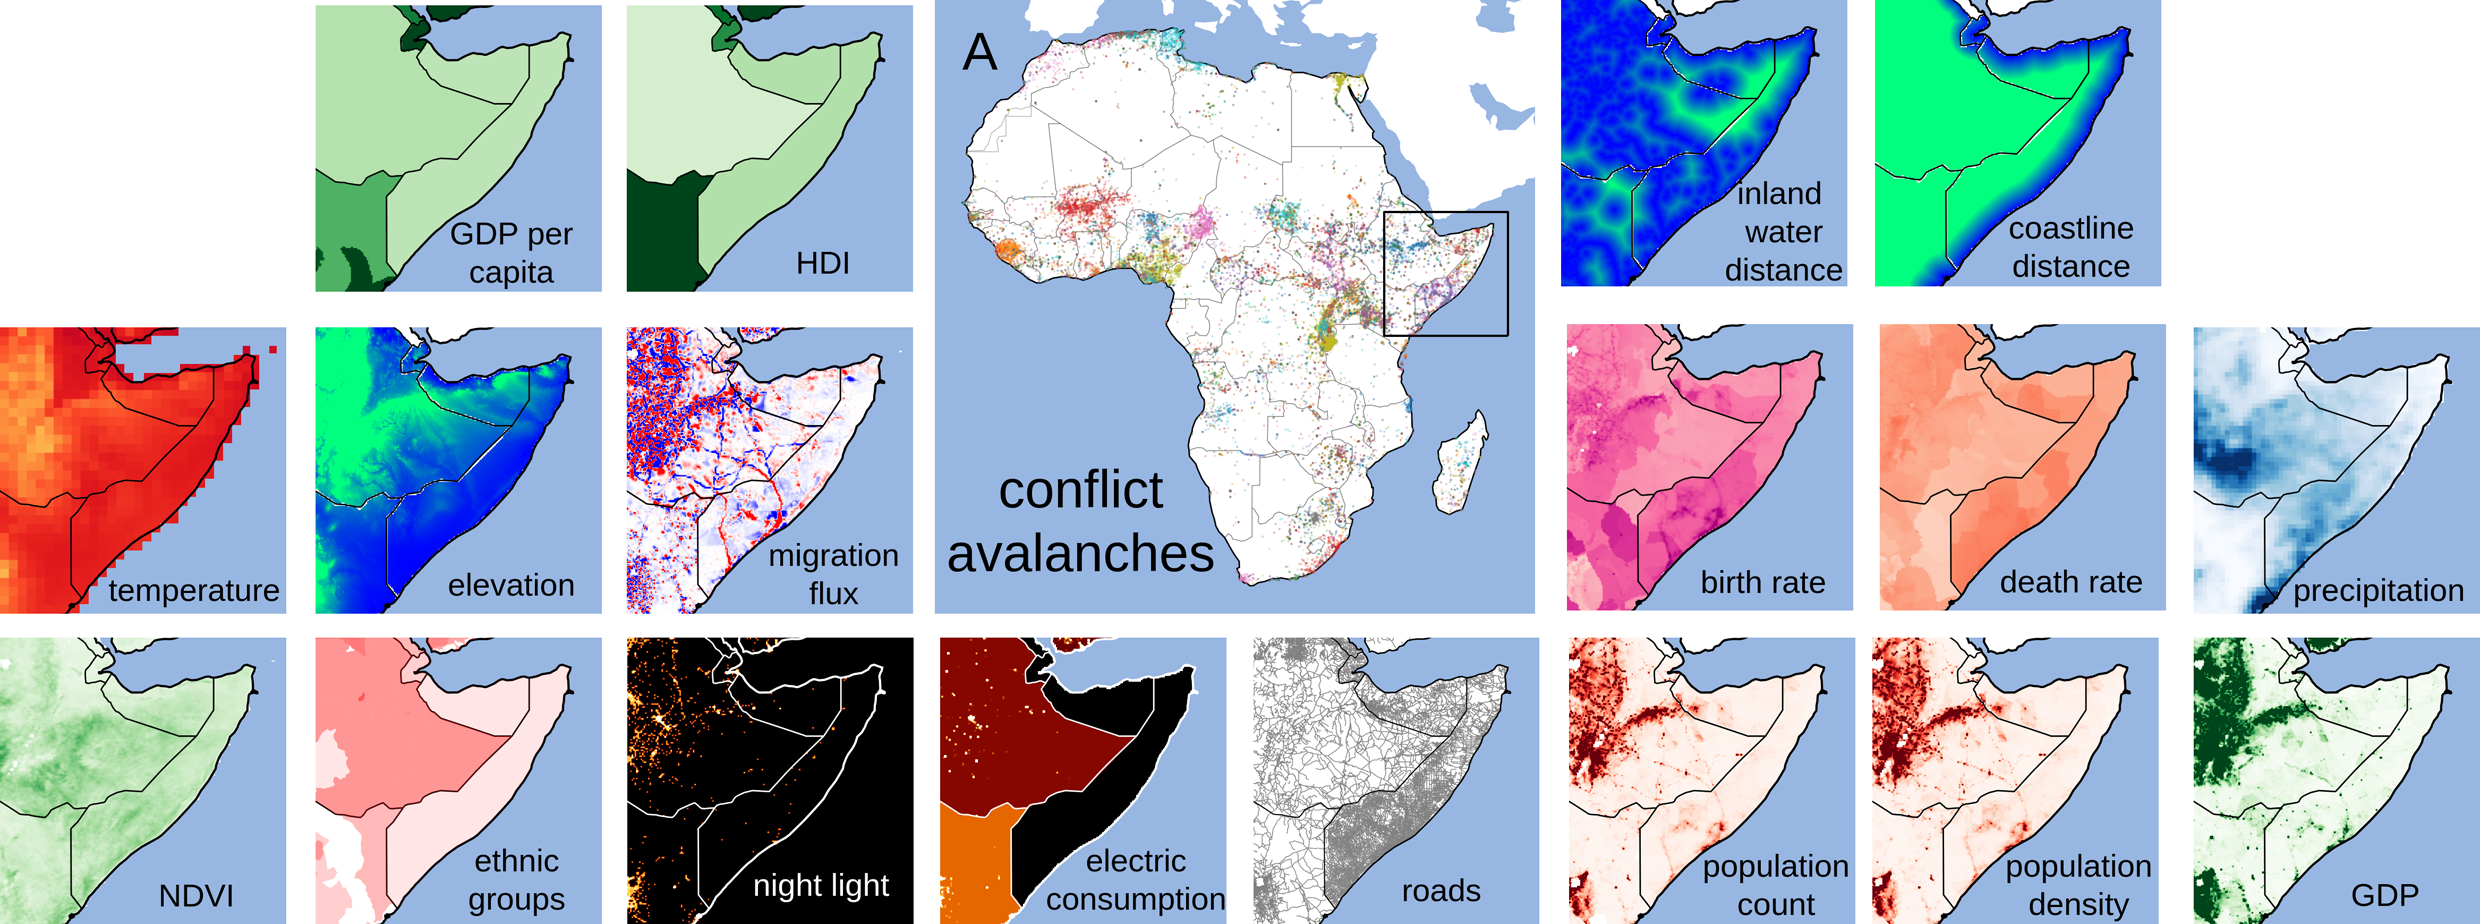
To get away from relying on expert judgments, the authors of this article decided to rely upon data. They analyzed over 20 years’ worth of detailed records on conflict and event data from the Armed Conflict Location and Event Data Project (ACLED), along with data related to the continent’s climate, geography, infrastructure, economics, and population. Rather than instructing a computer to search for particular types of conflict, they allowed a machine-learning program to detect patterns.
Lee noted that “the new labels he created partially overlap with those created by experts, but the definition differs.” Expert knowledge provides insight into specific areas, but due to the volume of conflict, tens of thousands of conflicts that occur across multiple locations each year, no expert can account for the quantity and scope of conflicts. Therefore, analyzing these conflicts using an automatable and quantitatively driven approach will enable global transferability of an expert’s ability.
Instead of relying on conventional methods of analyzing violence, the researchers focused on determining when and how frequently clusters of violent incidents occurred in similar ways.
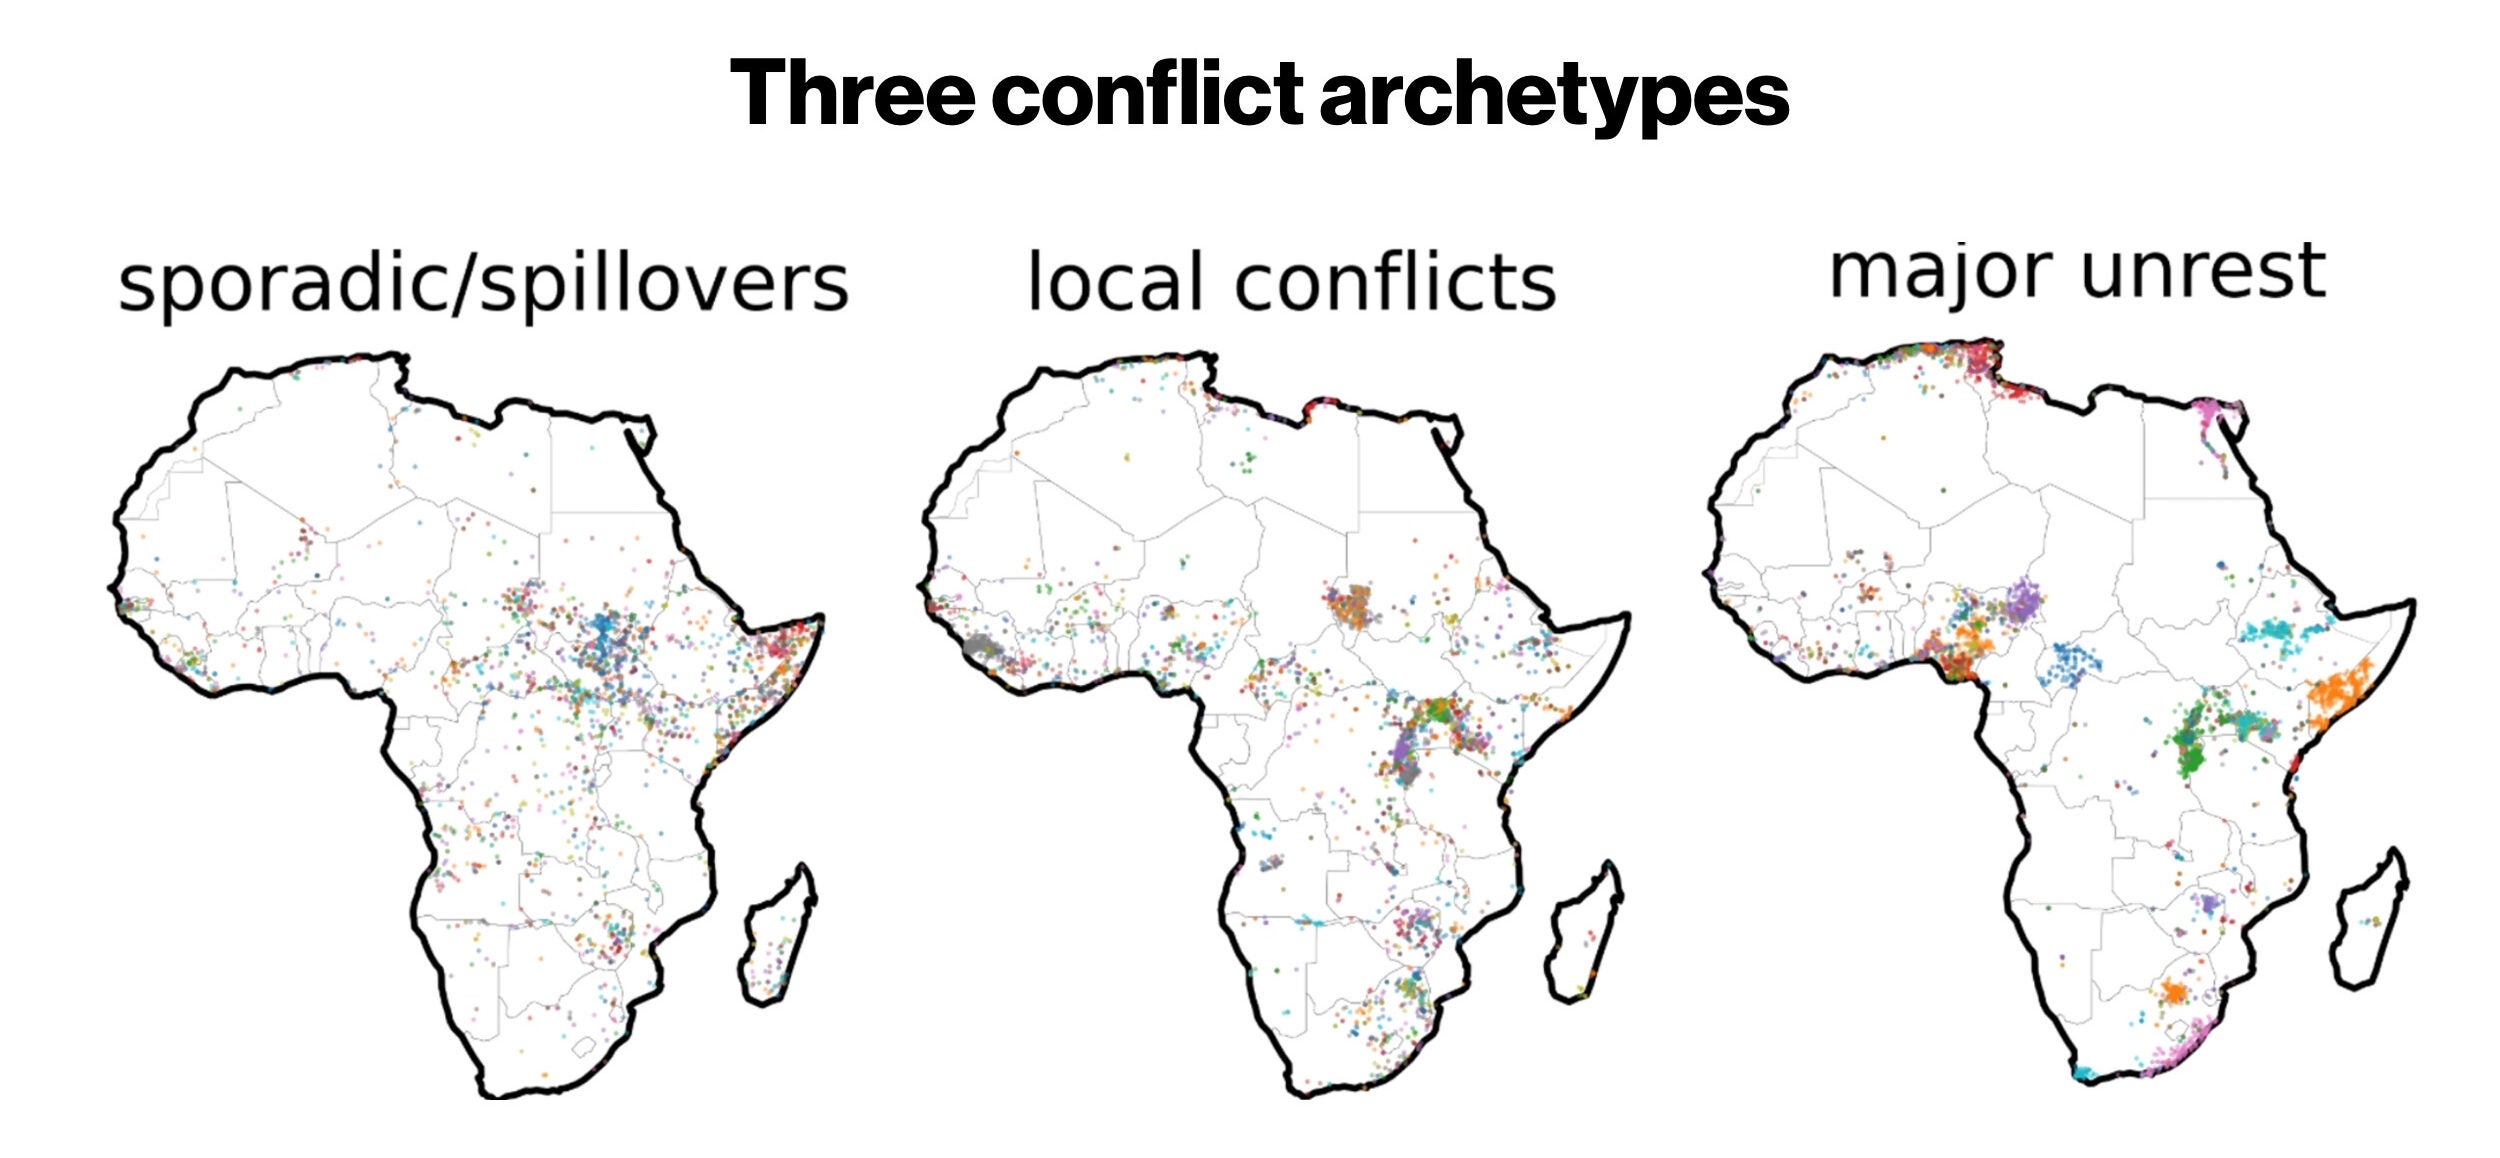
From the analysis of countless violent events since 1997, the researchers identified three archetypes. Whenever they tested different time periods or used different methods of spatial analysis, the patterns held true.
“Our method of algorithmic analysis derives the types of conflict from the data itself. It’s an extremely straightforward outcome,” Lee mentioned.
Major unrest is the first type, which encompasses long-term violent conflict, including Boko Haram’s insurrection and the ongoing civil war in the Central African Republic (CAFR). The unrest tends to occur in large, dense urban areas that have ample means of communication and travel. The incidents frequently spread across multiple national borders and continue for extended periods.
Local conflict is the second of the three types of conflict and captures the violence that happens within the geographic boundaries of one country. Examples of this type of conflict include the Seleka and the anti-Balaka conflict in the Central African Republic. In most cases, local conflicts last for months rather than for years, and these conflicts are limited to certain geographical regions of the country.
The last type of conflict is considered to be sporadic or spillover type. These types of conflicts occur over a short duration, relatively, in an area that is remote, poorly connected, or possibly even nonexistent, and are often the result of a spillover of violence related to a nearby conflict. An example of a spillover from a conflict in Africa is the Al-Shabaab insurgency spreading into other parts of Somalia.
As Kushwaha states, “The existence of three separate types of conflict is a direct outcome of the data.”
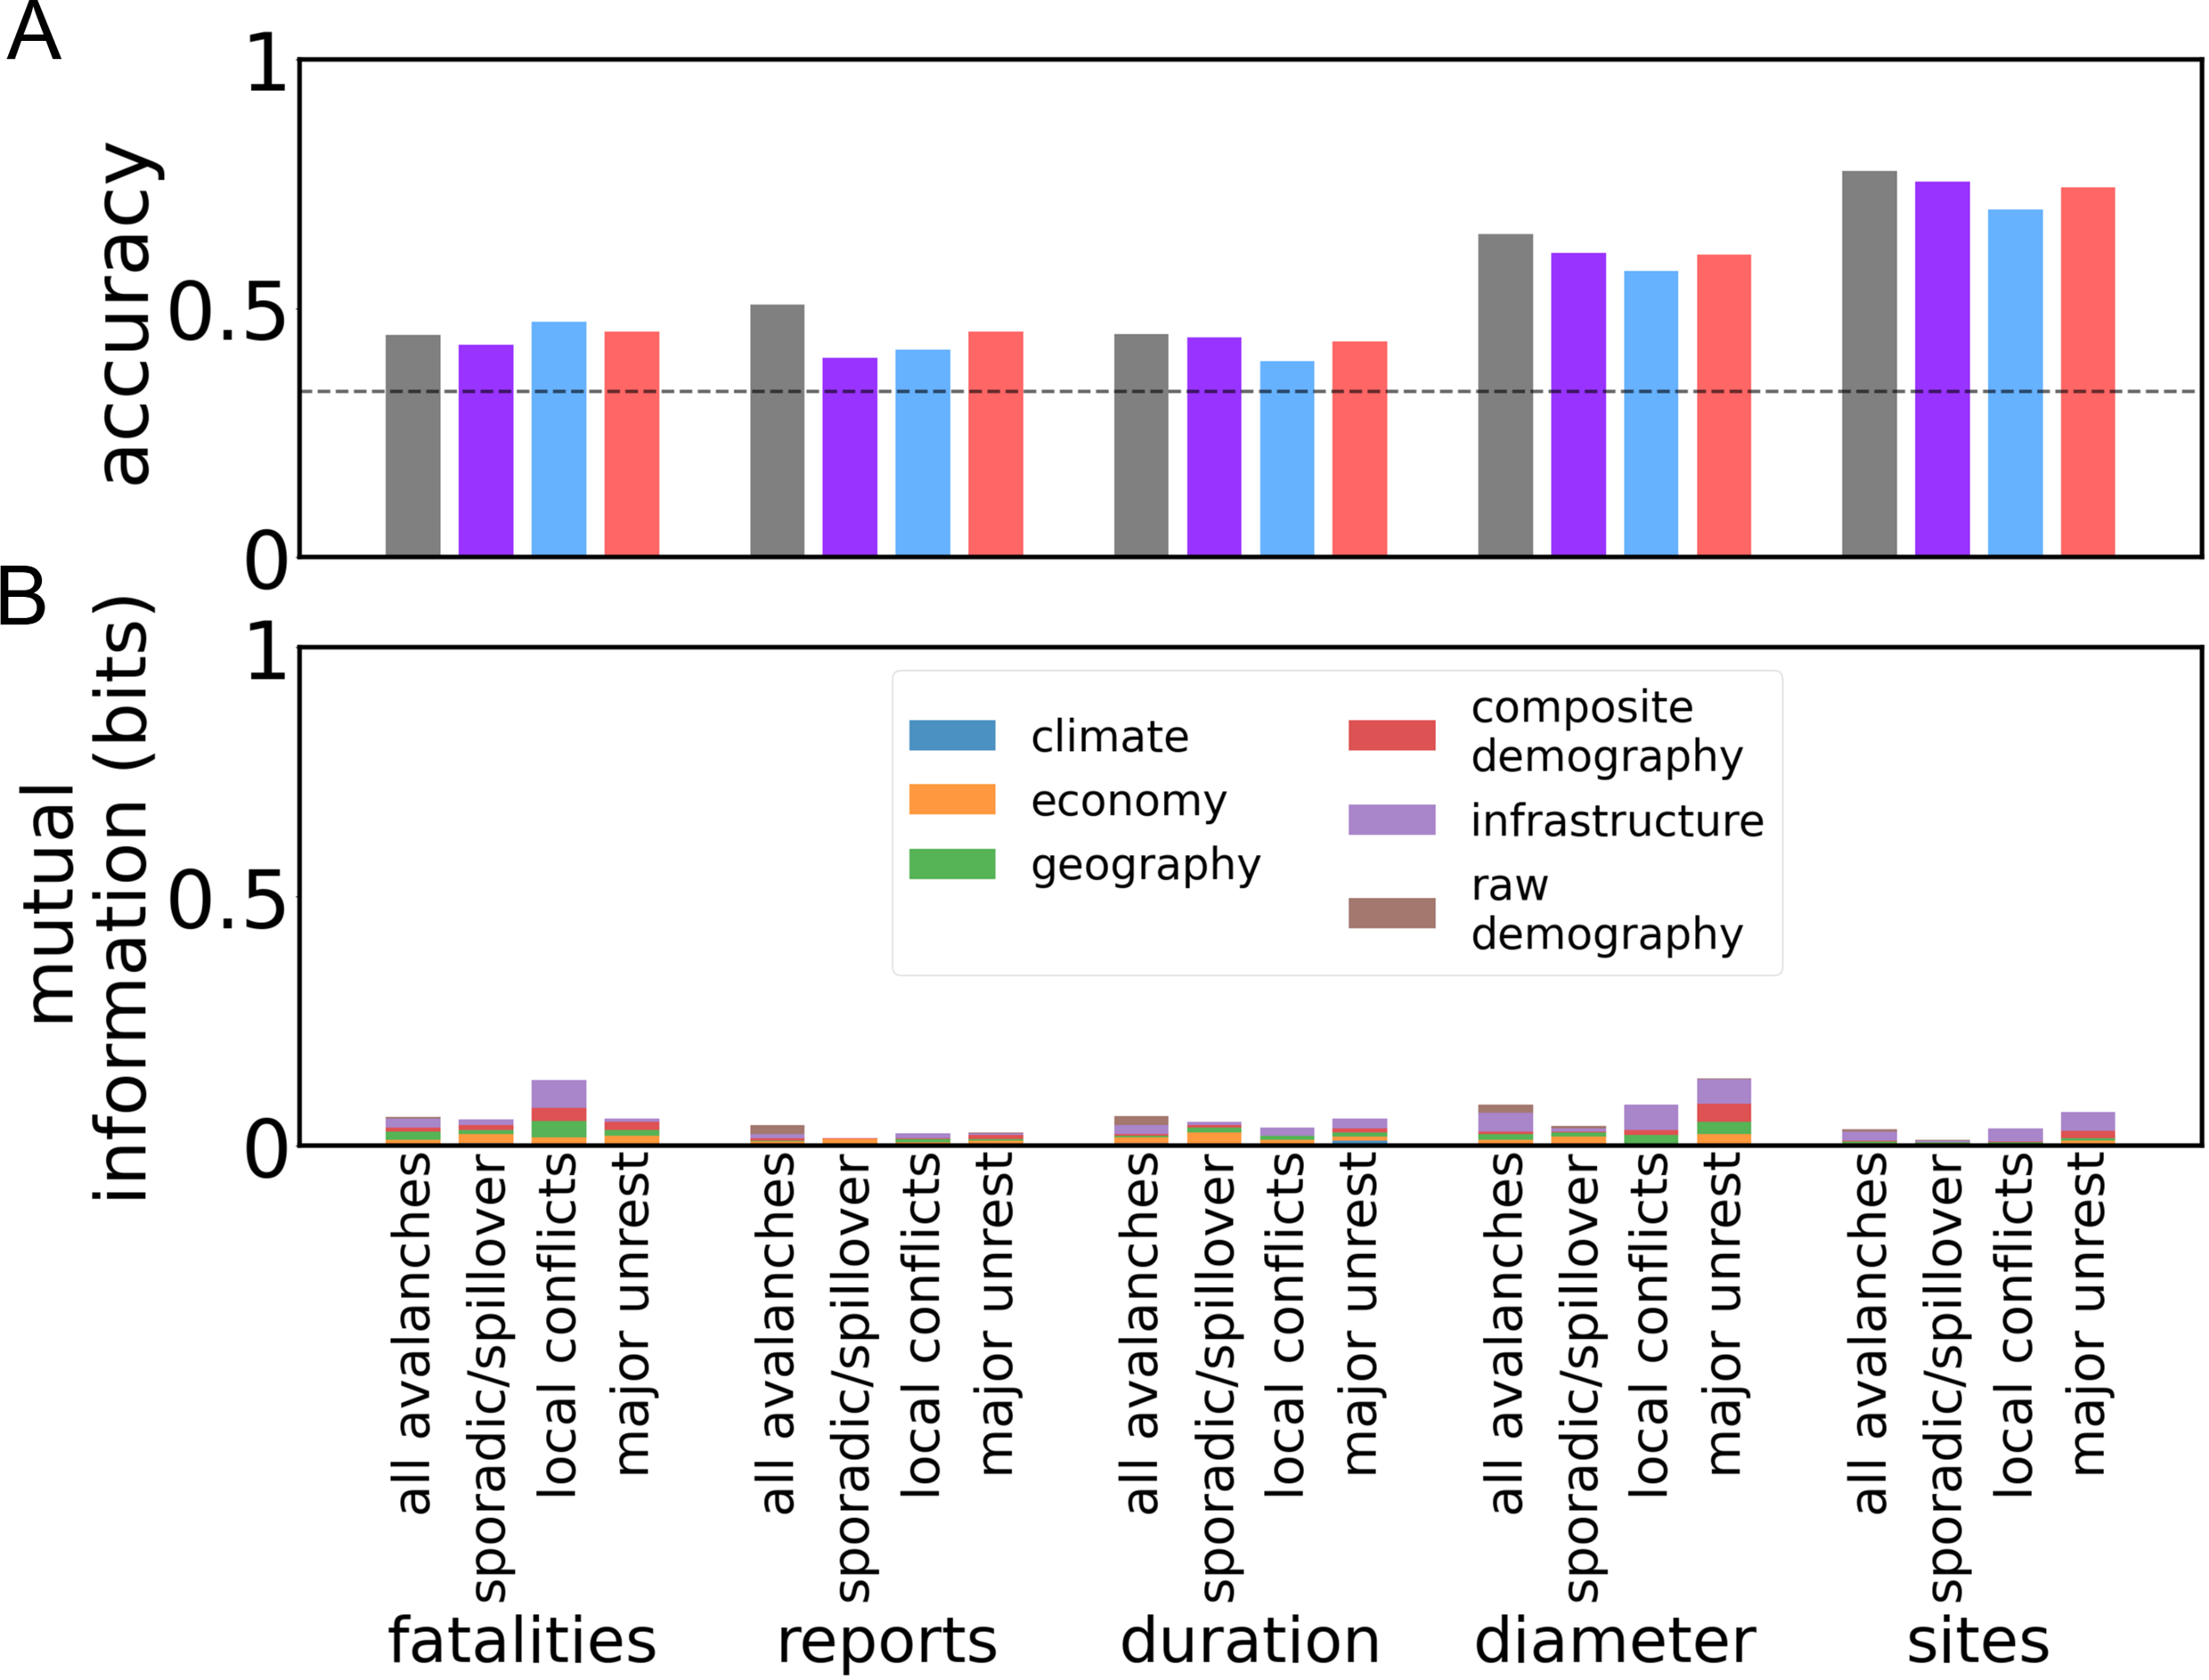
The team then tested the assumption that classifying conflict into three types would provide an increased ability to accurately predict the severity, or intensity, of the conflict. A common belief among analysts is that having knowledge of the type of a conflict will help predict the intensity, duration, or potential death toll.
However, the data indicated that the reverse was true.
“We, as scientists, are trying to derive the best predictions of conflicts from knowing the type of conflict. However, we found that knowing the type of conflict actually makes it harder to accurately predict the severity,” Kushwaha shared with The Brighter Side of News. “In fact, when adding the conflict type information to the traditional prediction models, many of the traditional models lost significant predictive capability.”
Through analysis, it appears there is little correlation between death toll and duration and the three types of conflict. Sometimes, adding the type of conflict information caused models to produce worse predictions. This does seem to go against the intuition of many.
Conflicts are labeled differently based on how they occur or spread. While, for example, systematic classification of “urban versus rural” helps us understand how urban conflict spreads across multiple municipalities, as the preceding quoted passage states, “You’d think better classification would help predict.” However, “the data tell us they are fundamentally different problems.” This statement also suggests several things.
This data and analysis represent a new beginning for how we view the potential impact of loss of life on populations. There is great value in better understanding the differences between rural and urban conflict dynamics and providing data to assist in targeting humanitarian aid based on that understanding.
A key component of this new study is the ability for policymakers and humanitarian agencies to develop targeted strategies to prevent, mitigate, or respond to conflict based upon the intent of the conflict.
“Our contribution is to show how to integrate the data about the many fine-grained data types that might be important for understanding how conflicts start, spread, and evolve,” explained Woi Sok Oh from the University of Waterloo.
The study compares conflicts occurring in large, dense urban areas to those along sparsely populated borders, indicating differing strategies required for each geographic area. The study also indicates that no established category of conflict will provide a reliable signal as to how large an amount of violence may occur in the future.
For researchers, this study challenges current practices of relying on established labels, while providing an opportunity to improve the ability to predict future conflicts with the use of better data. At the same time, it will be vital to consider the limitations of existing datasets in order to build a solid foundation for future research, Lee said. Moreover, he believes that “there are many datasets, most of which have been developed over centuries,” that provide valuable indicators of potential future conflicts.
This study provides a foundation for studying the limits of the existing datasets available globally, as well as for developing more accurate methods for assessing and exploring the forces driving conflict.
As a consequence of this study, there are several practical implications for individuals and organizations. For instance, improving coordination of conflict labels to allow for comparative analysis may assist in better planning for a more individualized approach to preventing and responding to conflict.
With this information, humanitarian assistance organizations and governments should not base their decisions on the severity of conflict solely on the label. They should prepare to respond to events with greater flexibility and less reliance on established systems of early warning signals.
Likewise, researchers should continue to explore new methods for measuring conflicts beyond traditional indicators and datasets in order to enhance their sources of information about conflict dynamics and to build more robust early warning systems, reduce casualties, and limit waste.
Research findings are available online in the journal Royal Society Open Science.
Like these kind of feel good stories? Get The Brighter Side of News’ newsletter.
The post Machine-learning analysis reclassifies armed conflicts into three new archetypes appeared first on The Brighter Side of News.