The Milky Way’s centre looks nothing like the calm band of starlight you see from a dark hillside. In a new, ultra-wide radio mosaic, the region turns into a tangle of cold, threadlike gas structures. Chemical fingerprints are scattered through the scene like dye in water.
That mosaic, made with the Atacama Large Millimeter/submillimeter Array (ALMA) in Chile’s Atacama Desert, is the largest image ever assembled from ALMA observations. It covers the Milky Way’s Central Molecular Zone, or CMZ, which is the dense, dusty heart of the galaxy. Here, a supermassive black hole sits nearby. Star-forming gas gets pushed around by extreme conditions.
“It’s a place of extremes, invisible to our eyes, but now revealed in extraordinary detail,” says Ashley Barnes, an astronomer at the European Southern Observatory (ESO) in Germany and part of the team behind the work.
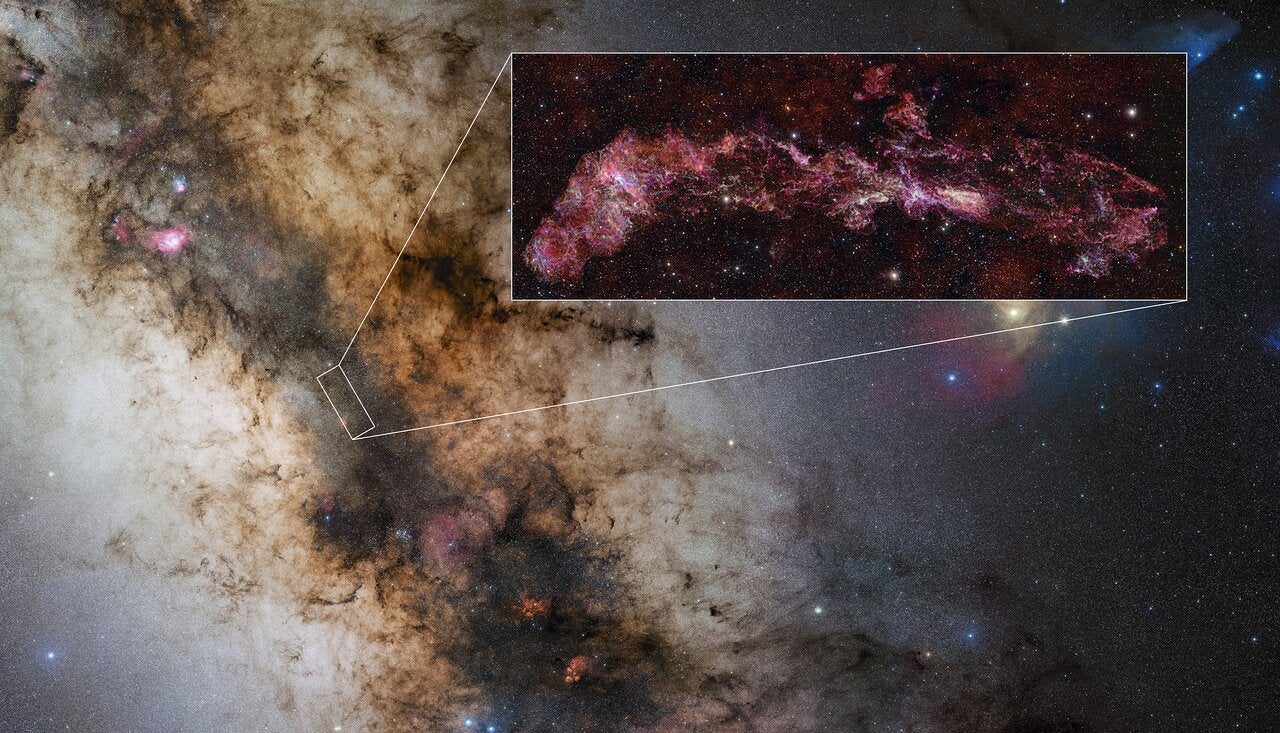
In the sky, the finished map spans the length of about three full Moons side-by-side. In physical size, the featured region stretches more than 650 light-years across. That makes it large enough to capture sweeping structures. However, the dataset also resolves down to small clouds associated with individual stars.
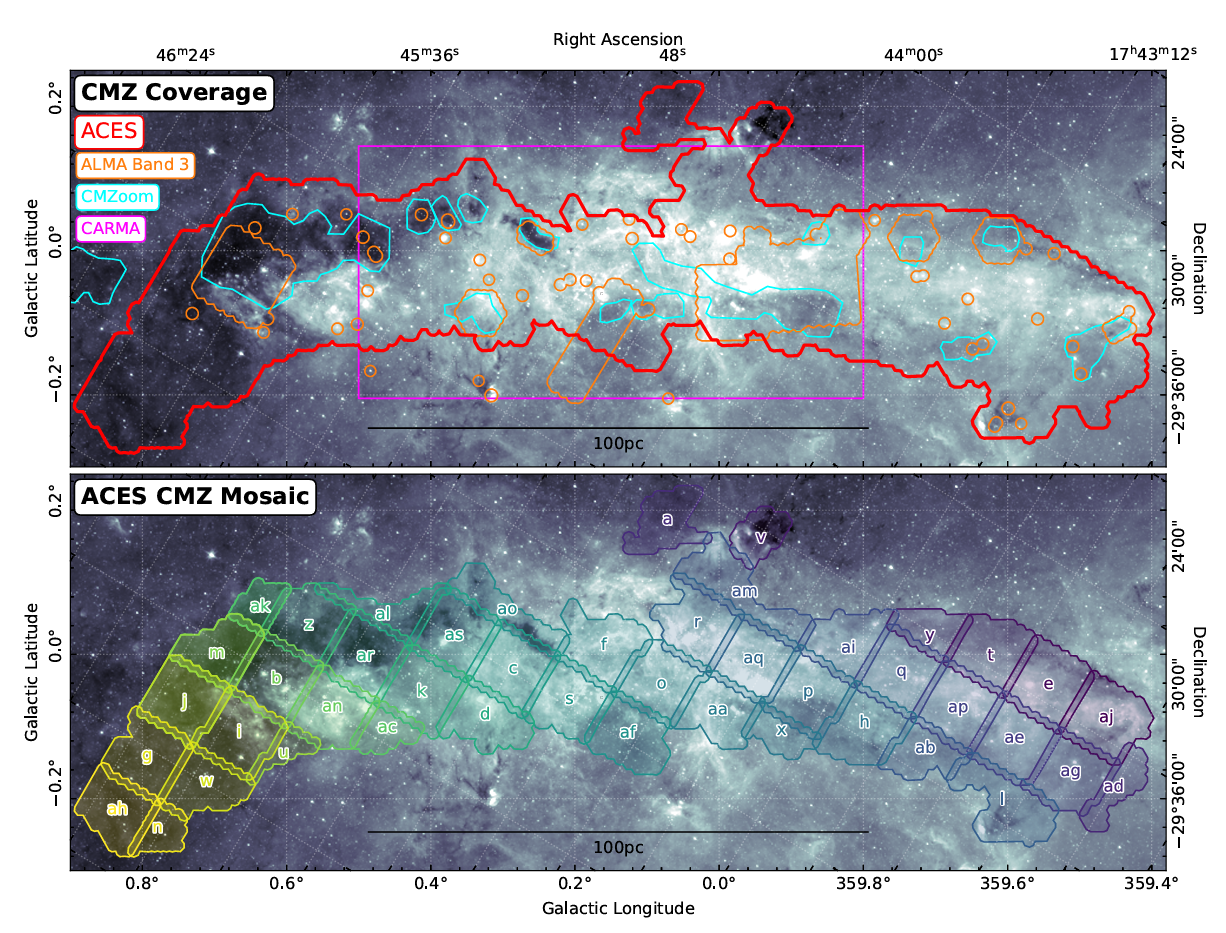
The image is part of a larger effort called ACES, short for the ALMA CMZ Exploration Survey. The project’s central aim is straightforward to say and hard to do. It seeks to track how gas turns into stars in a place where gravity, turbulence, shocks, magnetic fields, and rapid rotation all pile on at once.
Barnes calls the CMZ “the only galactic nucleus close enough to Earth for us to study in such fine detail.” That closeness matters because it gives astronomers a rare chance to connect big, galaxy-scale flows to the smaller physics of star birth.
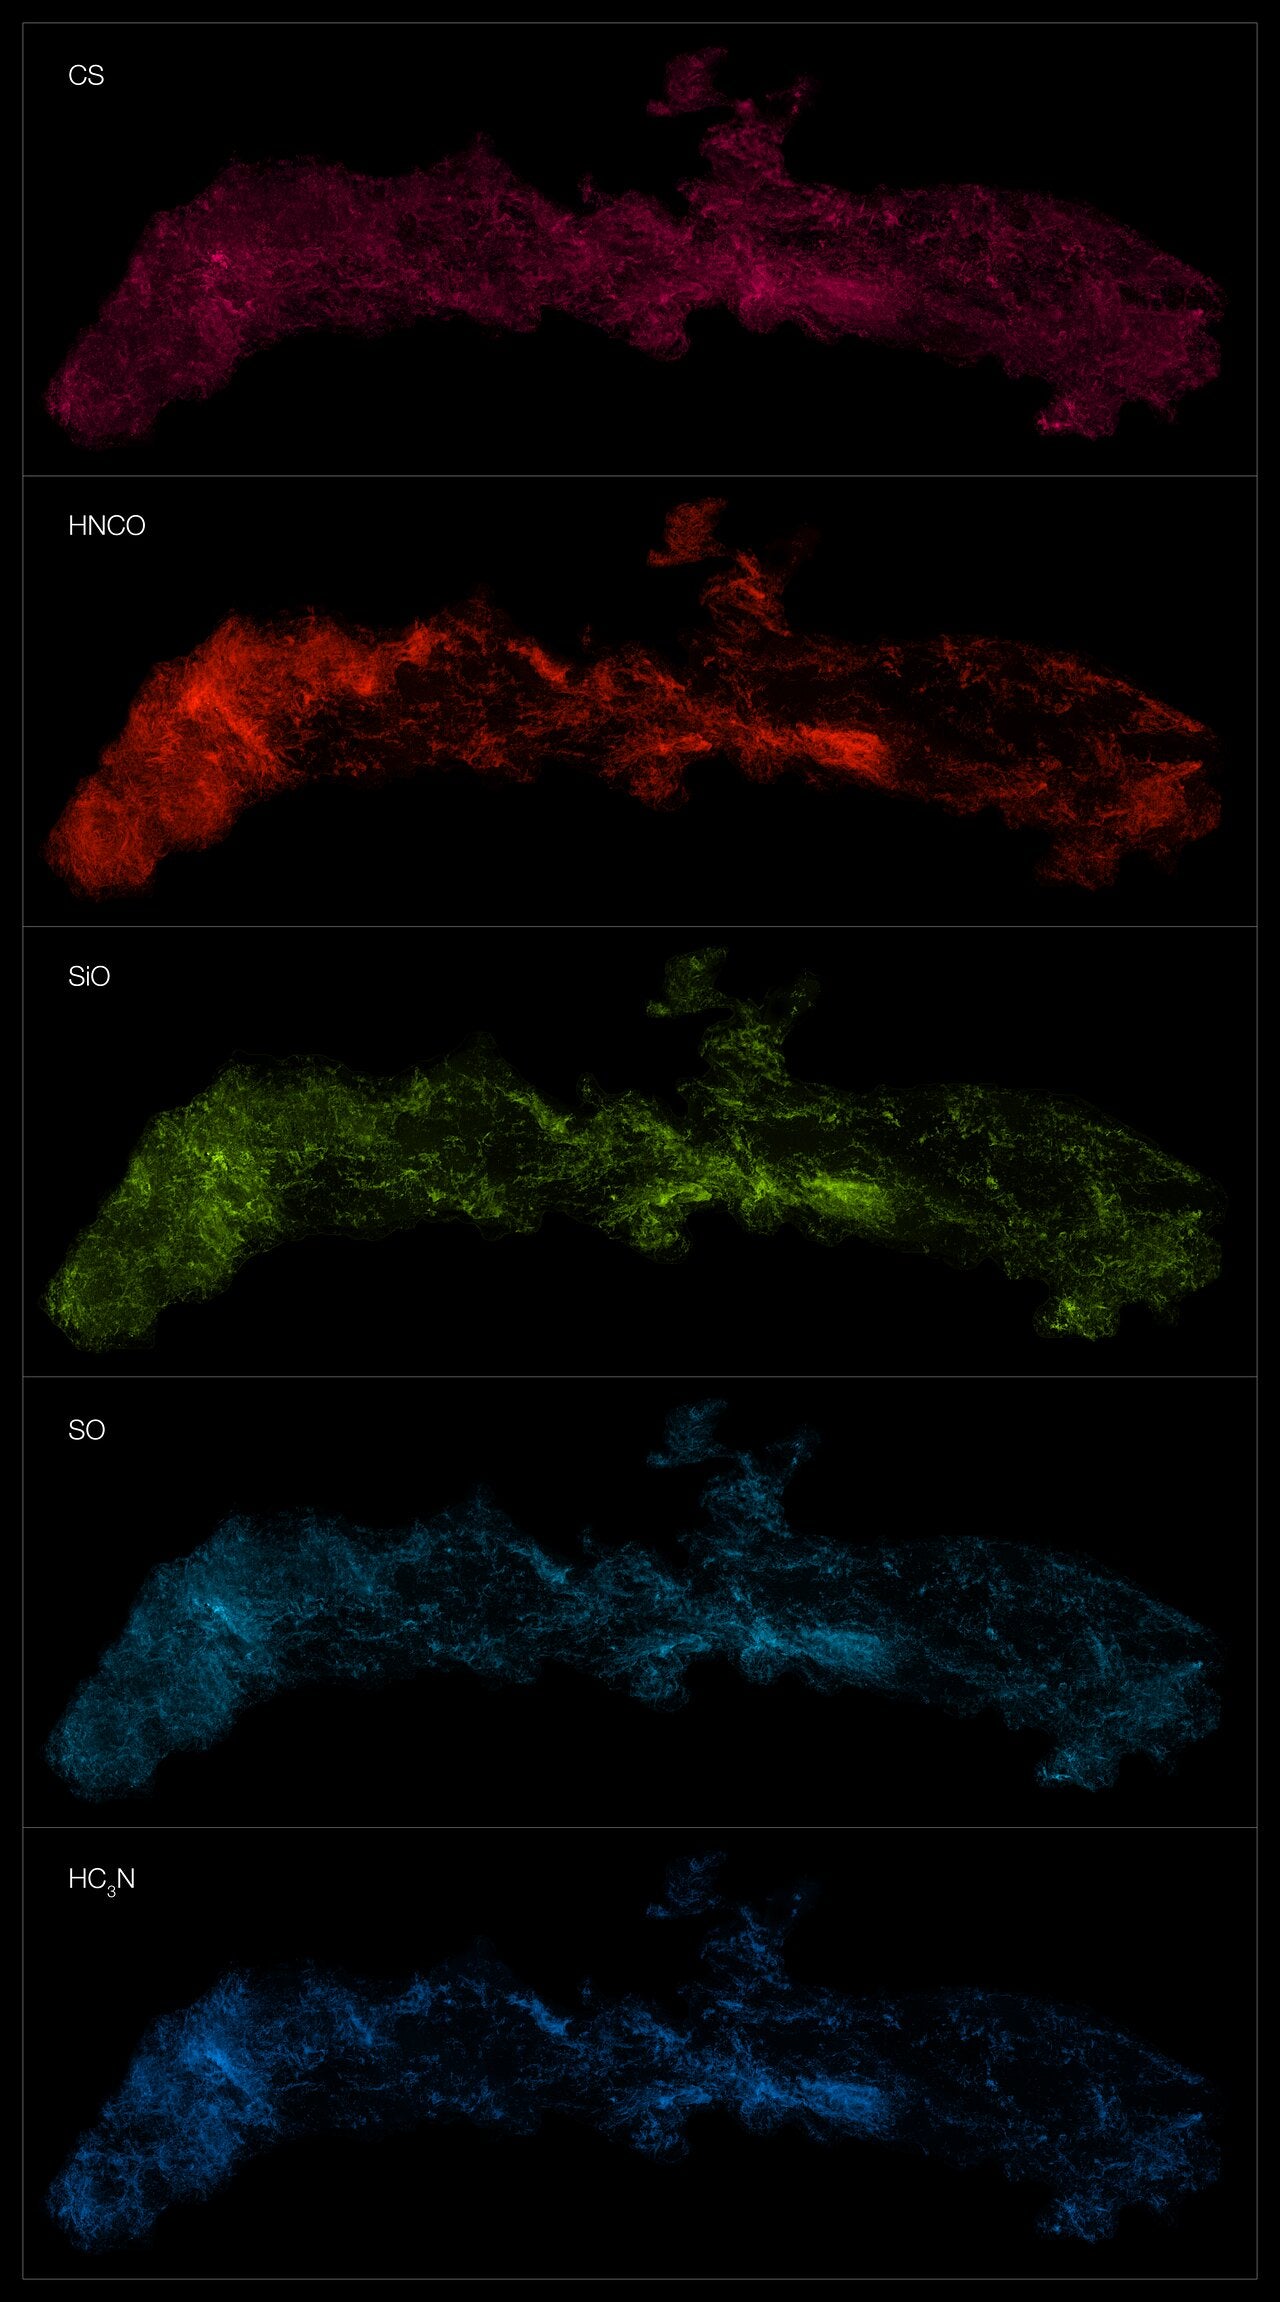
The public-facing image highlights five molecules in different colours, each one tracing different physical conditions in the gas: sulphur monoxide, silicon monoxide, isocyanic acid, cyanoacetylene, and carbon monosulphide. The map, the team notes, does not cover an entire rectangular frame, which is why the edges look sharp. The stars layered in front come from infrared observations with ESO’s VISTA telescope. The team also notes that the true stellar density in the CMZ is higher than shown.
One short way to describe what ACES is doing is “chemistry plus motion.” The survey detects dozens of molecules, from simpler species to more complex organic molecules such as methanol, acetone, and ethanol. Those chemical tracers help astronomers pick out shock-heated regions and dense pockets likely to collapse. They also reveal gas affected by irradiation or feedback.
In the outskirts of the Milky Way, star formation is often taught as a steady story: clouds cool, clumps form, gravity wins, and stars ignite. The CMZ refuses to behave that neatly.
“The CMZ hosts some of the most massive stars known in our galaxy,” says Steve Longmore, a professor of astrophysics at Liverpool John Moores University in the UK and the leader of ACES. Many of those stars “live fast and die young,” he says. They end in supernova explosions and, in some cases, hypernovae.
ACES is designed to test whether the usual rules still apply in this environment. Longmore also points to a bigger reason the community cares. He says, “By studying how stars are born in the CMZ, we can also gain a clearer picture of how galaxies grew and evolved.” The team argues the region shares features with star-forming galaxies in the early Universe. Here, conditions were more chaotic than in today’s galactic discs.
The survey’s technical choices reflect that ambition. ACES targets uniform ALMA Band 3 coverage across the inner CMZ, with an angular resolution of about 1.5 arcseconds. The overview paper describes this as roughly 0.05 parsec at the Galactic Centre. The setup includes multiple spectral windows. There are also two high spectral resolution windows centred on HCO+ and HNCO, chosen as reliable tracers of gas motion in this region.
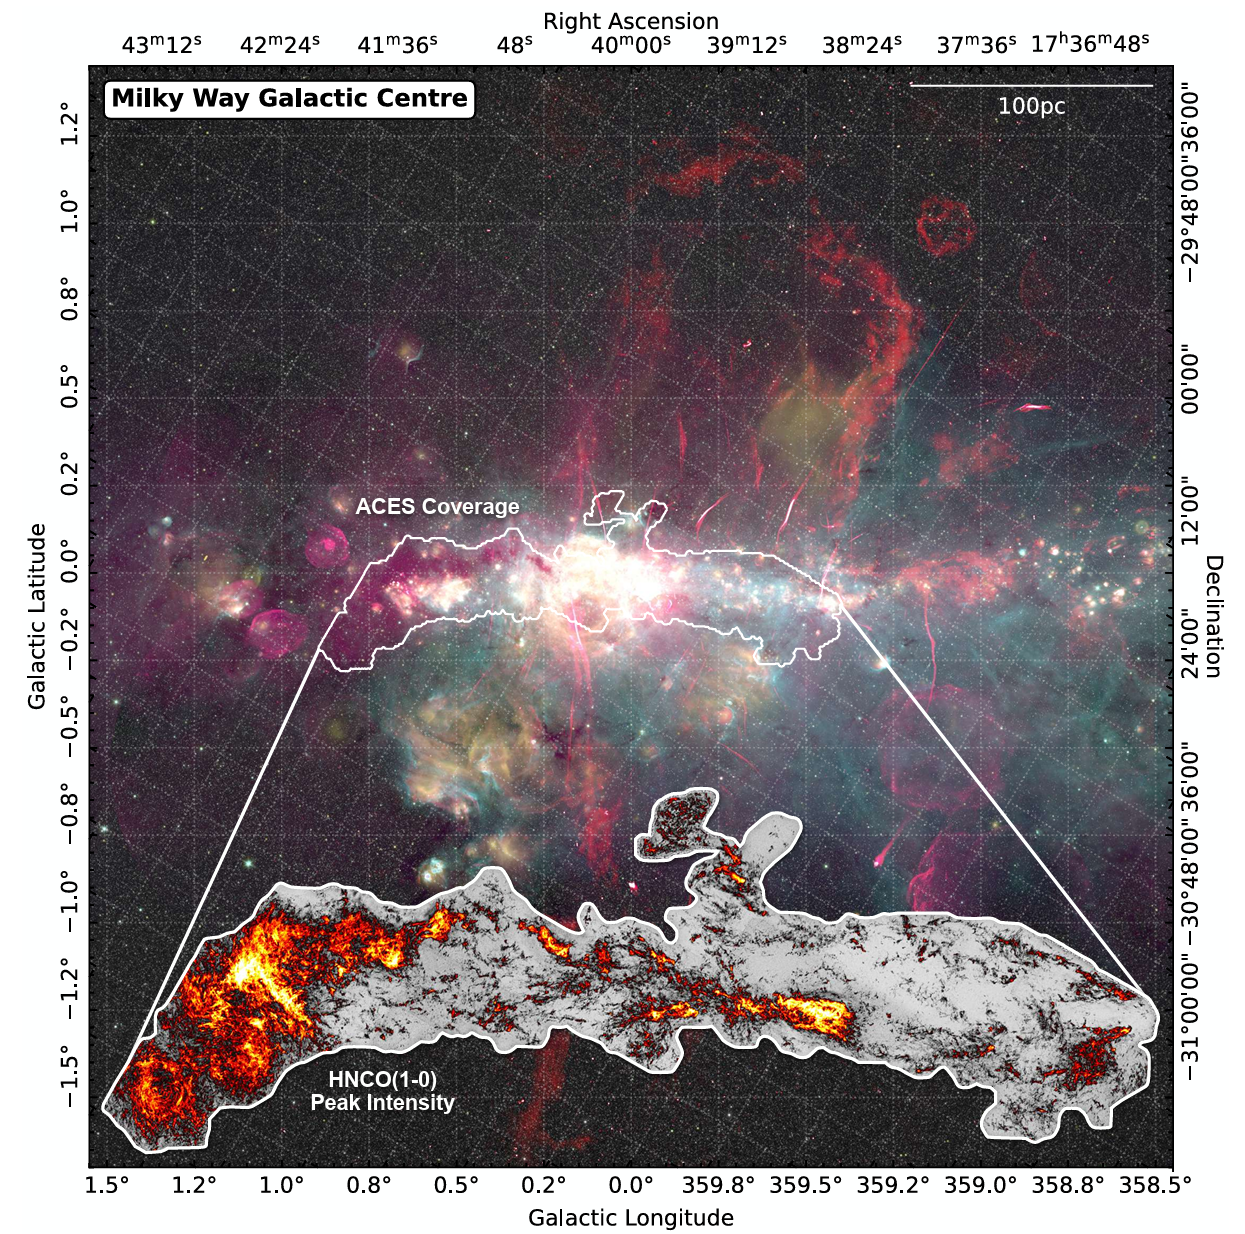
The survey area itself was defined by a threshold: gas above a column density of 10^22 cm−2, described in the overview paper as a level above which stars form in the Milky Way’s disc. Mapping that much territory at ALMA’s resolution is a major reason this became the facility’s largest contiguous mosaic.
“We anticipated a high level of detail when designing the survey, but we were genuinely surprised by the complexity and richness revealed in the final mosaic,” says Katharina Immer, an ALMA astronomer at ESO who is also part of the project.
The team says the ACES results are being presented across multiple papers, with five accepted in Monthly Notices of the Royal Astronomical Society and a sixth in the final review stages.
Wide surveys do not just confirm what scientists think they know. They also trip over things nobody predicted.
The overview paper highlights several early science results. One example is an expanding ring of dense, shocked gas called the M0.8−0.2 ring. The description given here lists a radius of 6.1 parsecs and an expansion velocity of about 21 km/s. Its mass approaches 10^6 solar masses. The analysis argues its kinetic energy and momentum point to a very energetic origin. It proposes a single hypernova as the most plausible driver, rather than early-stage stellar feedback or multiple clustered supernovae.
Another highlighted case is a compact source near the so-called 50 km/s cloud, dubbed the “Millimeter Ultra-Broad Line Object,” or MUBLO. The source appears very small, with exceptionally broad molecular line emission in SO, SO2, and CS. It lacks obvious counterparts at infrared, centimetre, or X-ray wavelengths in the description provided.
The overview lists several possible explanations, including outflows, an evolved star, a merger remnant, or gas bound to an intermediate-mass black hole. However, it notes that none fully explain the observations.
Those examples help explain why the team is eager about what comes next. Barnes points to an upcoming ALMA sensitivity upgrade and ESO’s Extremely Large Telescope as tools that could push further. They could resolve finer structures and trace more complex chemistry.
Research findings are available online in the ACES overview paper.
The original story “Largest image of its kind reveals the Milky Way’s core looks like a web of cold gas” is published in The Brighter Side of News.
Like these kind of feel good stories? Get The Brighter Side of News’ newsletter.
The post Largest image of its kind reveals the Milky Way’s core looks like a web of cold gas appeared first on The Brighter Side of News.