The space between galaxies is not empty. In a new map of the early universe, those “blank” stretches take on a faint, hydrogen-blue glow that had mostly escaped surveys until now.
Astronomers working with the Hobby-Eberly Telescope Dark Energy Experiment, better known as HETDEX, say they have built the largest and most accurate 3D map yet of a specific ultraviolet fingerprint from hydrogen called Lyman alpha. The map covers light emitted roughly 9 billion to 11 billion years ago, a period when the universe was busy making stars, and lighting up hydrogen atoms across enormous distances.
“Observing the early universe gives us an idea of how galaxies evolved into their current form, and what role intergalactic gas played in this process,” said Maja Lujan Niemeyer, a HETDEX scientist and recent graduate from the Max Planck Institute for Astrophysics who led the map’s development. “But because they are far away, many objects in this time are faint and difficult to observe.”
Lyman alpha is produced in large quantities when hydrogen atoms get energized by starlight. That makes it a strong beacon for finding bright, distant galaxies, and HETDEX already uses it to chart more than one million bright galaxies as part of its dark energy program. The problem is everything else.
Fainter galaxies and diffuse gas also emit Lyman alpha, but their signals blend into noise when you hunt for objects one by one. HETDEX’s standard approach, built to find clear, bright detections, leaves much of that dim background unclaimed.
“However, we only use a small fraction of all the data we collect, around 5%,” said Karl Gebhardt, HETDEX principal investigator, chair of The University of Texas at Austin’s astronomy department, and a co-author on the paper. “There’s huge potential in using that remaining data for additional research.”
“HETDEX observes everything in a patch of sky, but only a tiny amount of that data is related to the galaxies that are bright enough for the project to use,” Lujan Niemeyer added. “But those galaxies are only the tip of the iceberg. There’s a whole sea of light in the seemingly empty patches in between.”
The new work tries to chart that sea.
Results were published in The Astrophysical Journal.
The team relied on a technique called Line Intensity Mapping. Instead of building a catalog of individually detected galaxies, intensity mapping tracks the overall distribution of a chosen “line” in a spectrum across a wide region of space.
All light can be separated into a spectrum, where specific wavelengths show up as peaks and valleys that correspond to different elements. In this case, the team focused on the Lyman alpha line from hydrogen. Intensity mapping does not demand that each patch of sky contain a clean, obvious galaxy. It uses noisy data to measure summary patterns in the light, so the combined contribution from faint galaxies and diffuse gas still counts.
Julian Muñoz, a HETDEX scientist, assistant professor at UT Austin, and a co-author, offered a visual way to think about the difference.
“Imagine you’re in a plane looking down. The ‘traditional’ way to do galaxy surveys is like mapping the brightest cities only: you learn where the big population centers are, but you miss everyone that lives in the suburbs and small towns,” Muñoz said. “Intensity mapping is like viewing the same scene through a smudged plane window: you get a blurrier picture, but you capture all the light and not just the brightest spots.”
Intensity mapping itself is not new. The team says this is the first time it has been used to chart Lyman alpha emission with this much precision across such a large dataset.
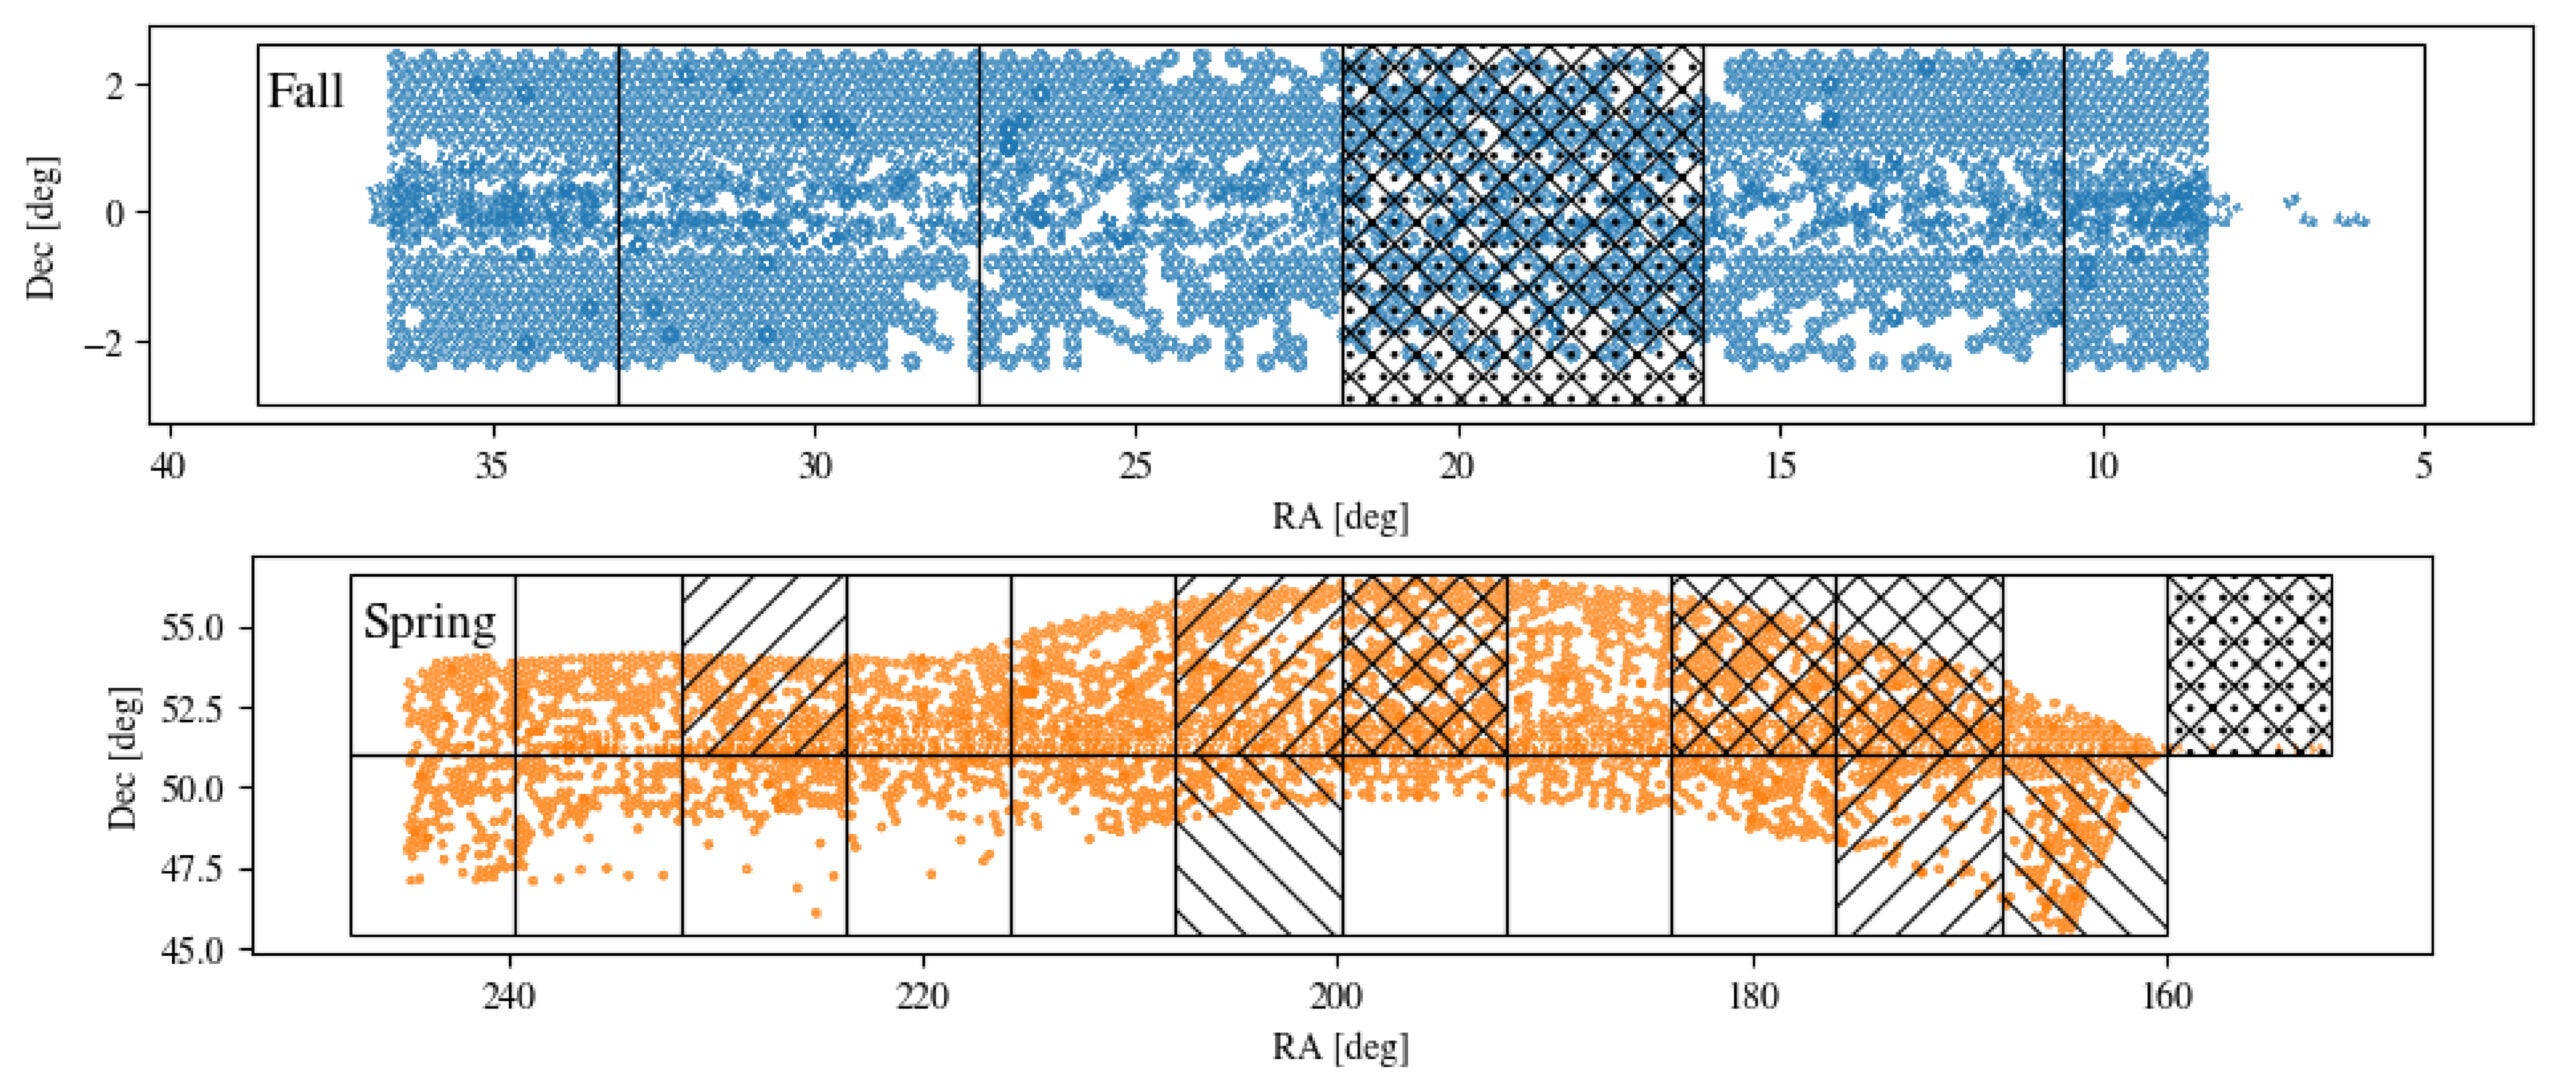
HETDEX is unusual for its scale. It has gathered more than 600 million spectra across a swath of sky larger than 2,000 full Moons.
To build the new map, the researchers wrote custom programming and used supercomputers at the Texas Advanced Computing Center to sift through roughly half a petabyte of HETDEX data. They then used the positions of bright galaxies already identified by HETDEX to help locate the faint stuff that does not show up as a clean detection.
Gravity plays a key role in that step. Matter clumps. Where you find a bright galaxy, you often find nearby fainter galaxies and gas as well, even if they hide below the threshold of a typical catalog.
“So, we can use the location of known galaxies as a signpost to identify the distance of the fainter objects,” said Eiichiro Komatsu, a HETDEX scientist, scientific director at the Max Planck Institute for Astrophysics, and a co-author on the paper.
The end product is not a simple list of galaxies. It is a 3D picture of where hydrogen’s Lyman alpha glow piles up, including around known bright galaxies and in the less obvious stretches between them.
The early universe in this era does not come with direct photographs. Astronomers often rely on computer simulations to explore how galaxies and gas should behave at these times, then test those simulations against whatever the sky allows them to measure.
“We have computer simulations of this period,” Komatsu said. “But those are just simulations, not the real universe. Now we have a foundation which can let us know if some of the astrophysics underpinning those simulations is correct.”
The team also described the map as a starting point. They want to compare their Lyman alpha intensity map with other maps that cover the same region but track different elements. One example they highlighted is carbon monoxide, which is associated with dense, cold clouds where stars form. A carbon monoxide intensity map could offer a different view of the conditions around the young stars that drive Lyman alpha emission.
“This study is a first detection, which is exciting on its own, and it opens the door to a new era of intensity-mapping the universe,” Muñoz said. “The Hobby-Eberly is a pioneering telescope. And with new, complementary instruments coming online, we’re entering a golden age for mapping the cosmos.”
For astronomers, the immediate impact is simple: this approach turns “leftover” survey data into usable information about faint galaxies and intergalactic gas. That helps fill in a missing layer of the cosmic web during a key era of star formation, rather than focusing only on the brightest galaxies.
The map also gives researchers a real-world reference point for testing and improving simulations of galaxy growth and the behavior of gas between galaxies.
Over time, comparisons with intensity maps of other elements could sharpen the picture of where stars formed, what surrounded those star-forming regions, and how matter clustered on large scales in the young universe.
Research findings are available online in The Astrophysical Journal.
The original story “Astronomers built the largest and most accurate 3D map of the ultraviolet universe” is published in The Brighter Side of News.
Like these kind of feel good stories? Get The Brighter Side of News’ newsletter.
The post Astronomers built the largest and most accurate 3D map of the ultraviolet universe appeared first on The Brighter Side of News.


Leave a comment
You must be logged in to post a comment.