East Asia’s rainiest summer in decades became a brutal test for the next generation of climate models. The question was not whether the season was extreme. Instead, it was whether the newest global simulations could finally track the storm systems doing most of the damage.
In the summer of 2020, parts of East Asia were drenched by record-breaking rainfall and catastrophic floods. Ten provinces in China flooded. Japan saw 1,000 millimeters of rain in three days. South Korea’s rainy season stretched to 54 days, far above its usual 32.
Much of that rain came from mesoscale convective systems, or MCSs. These are sprawling clusters of thunderstorms that can trigger flash floods, destructive winds, and prolonged downpours.
Older global climate models struggled with those systems. Their grid cells were too coarse to resolve thunderstorms directly. As a result, they relied on simplified approximations for convection. That often led to the wrong timing, the wrong intensity, and too much weak rain instead of the kind that breaks drainage systems and swamps rivers.
Now researchers have tested six global kilometer-scale models, a new class of simulations sharp enough to represent deep convection far more directly. In the new analysis, an international team examined how well those models reproduced MCS behavior during East Asia’s exceptionally wet summer of 2020.
The study, published in Advances in Atmospheric Sciences, focused on models from ECMWF, the Max Planck Institute, the UK Met Office, the U.S. Department of Energy, the University of Tokyo, and the Chinese Academy of Sciences. The research team was led by scientists from the Chinese Academy of Meteorological Sciences, Beijing Normal University, ETH Zurich, and the CAS Institute of Atmospheric Physics.
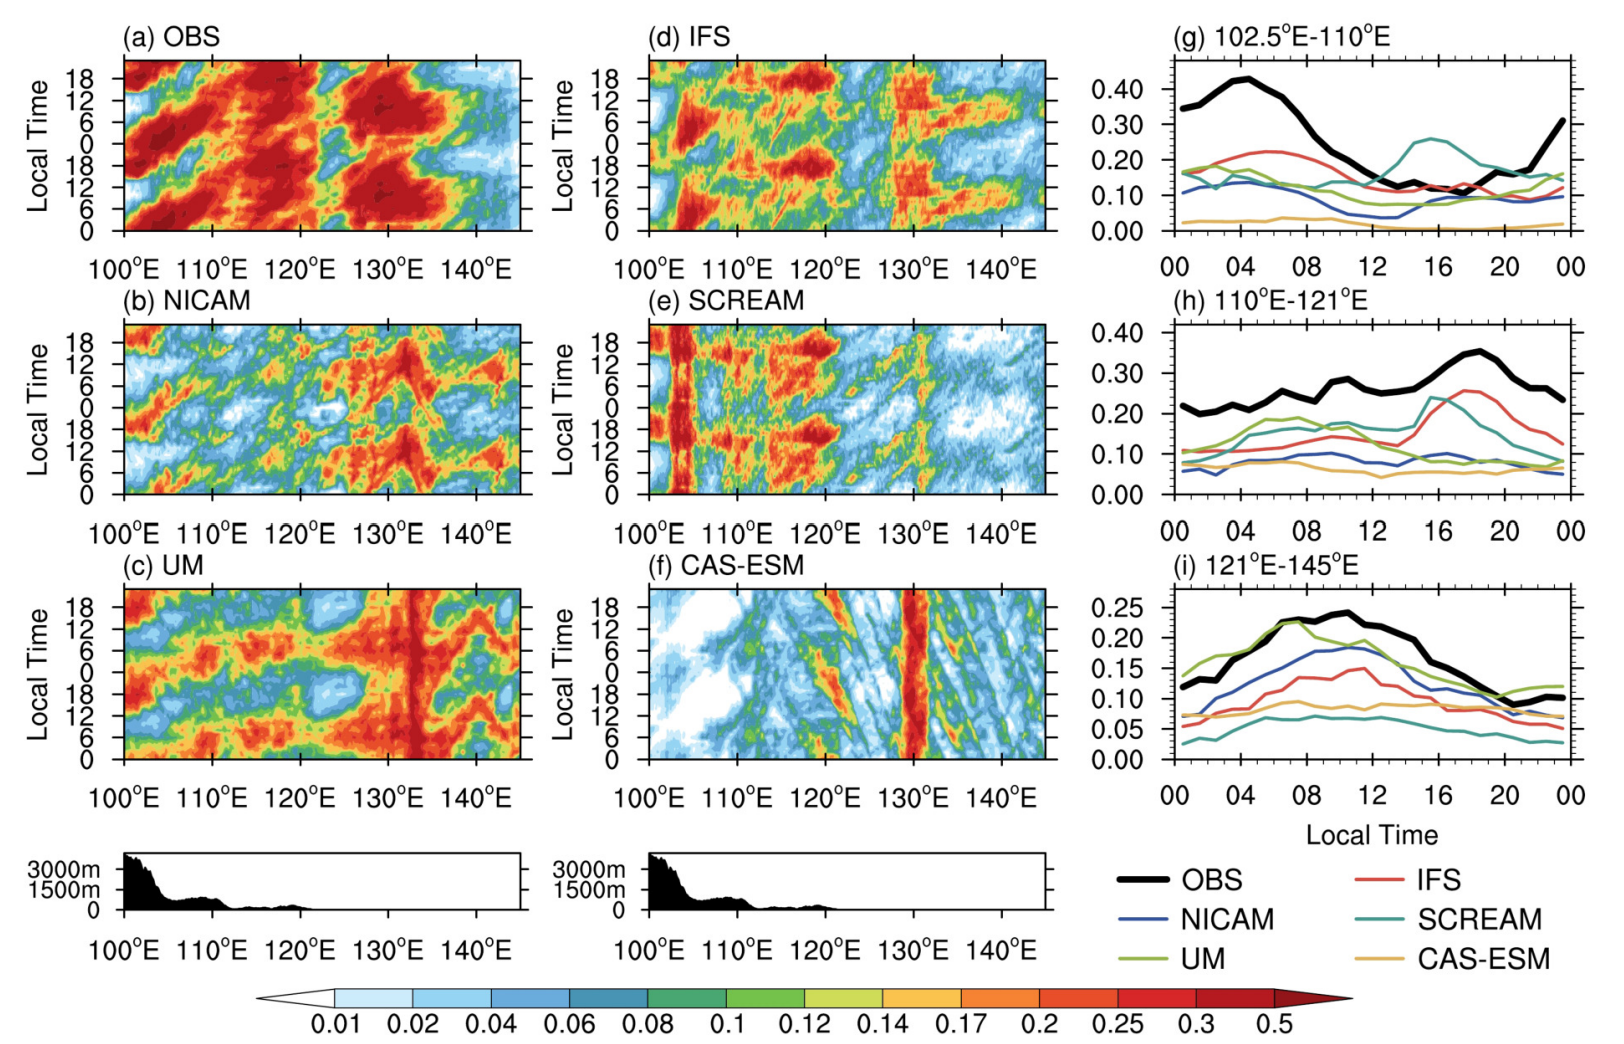
To judge model performance, the team compared the simulations with satellite observations and tracked storm systems across East Asia from June through August. They looked not just at where rain fell. They also examined how long storms lasted, how large they grew, how fast they moved, and how rainfall changed over the course of a day.
“The good news: these models mostly get the big picture right, where MCS rain falls, how long storms last, how fast they move, and their daily timing. ” said Xiaotong Huang, first author of the study and an M.Sc. candidate at the Chinese Academy of Meteorological Sciences.
That matters because these models are meant to do more than sketch broad climate trends. Their promise lies in showing how extreme weather actually unfolds.
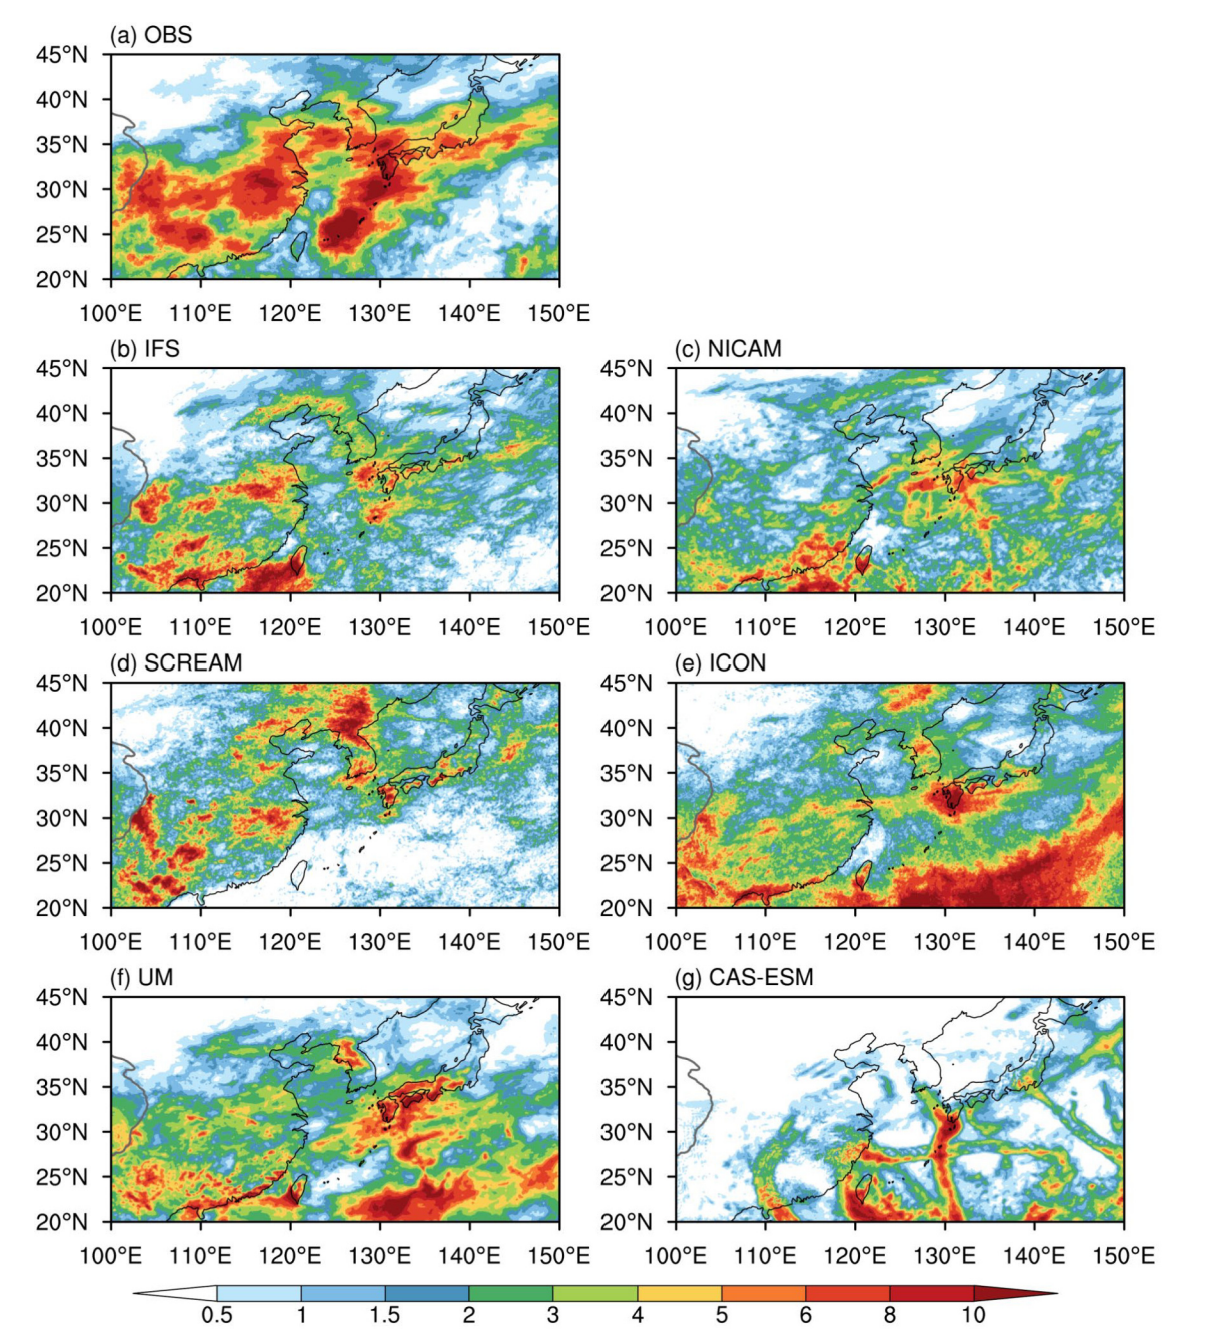
Overall, the six models reproduced the main spatial pattern of MCS rainfall during the 2020 summer. They captured major rainfall centers over the Sichuan Basin, the middle and lower Yangtze River basin, and the western North Pacific south of Japan. Several models also reproduced the eastward movement of storm-related rain downstream of the Tibetan Plateau. This is a key feature of East Asia’s summer weather.
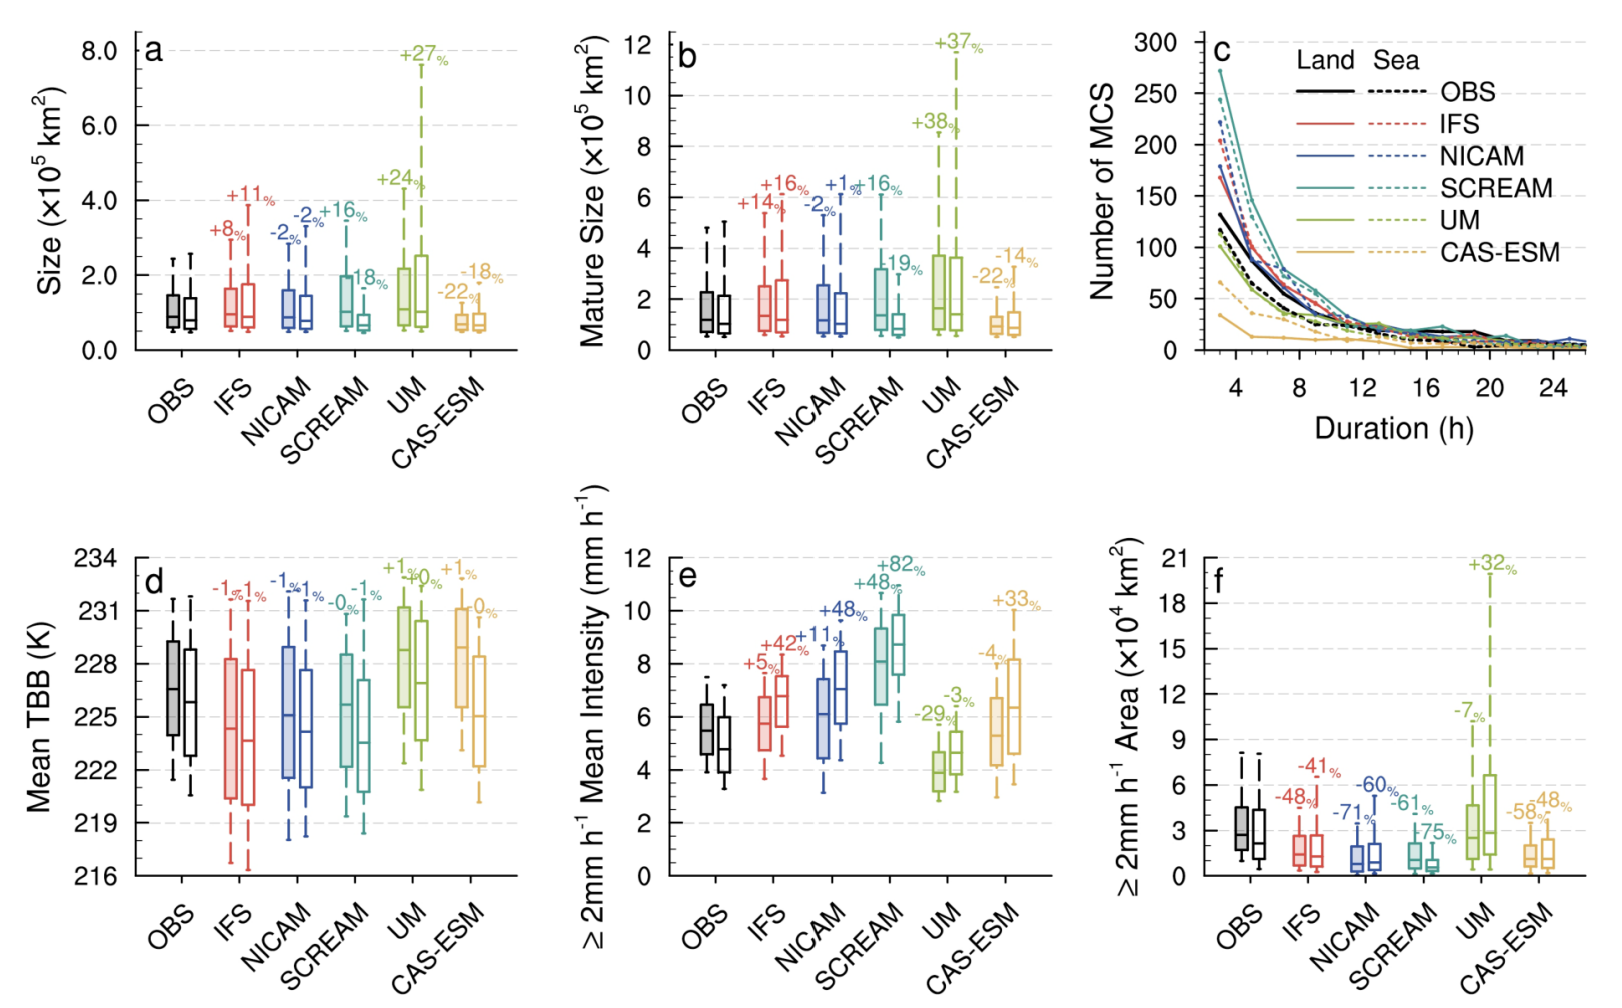
The simulations also did reasonably well on several storm characteristics. They broadly captured MCS size, duration, convection features, rainfall structure, and the daily cycle of activity. The study found that one model, IFS, performed best in reproducing the spatial pattern of MCS rainfall. NICAM came closest on storm size. SCREAM most accurately represented the contrast between land and sea in MCS rainfall intensity.
But the encouraging headline came with a warning label.
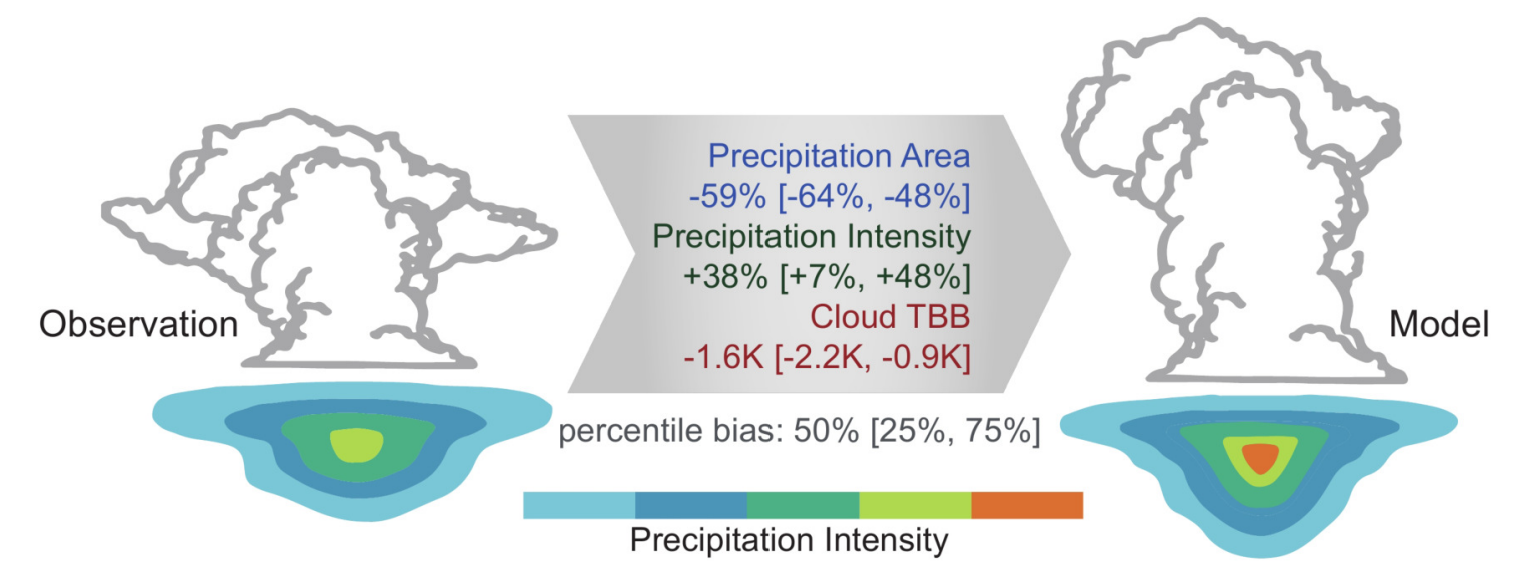
Despite their differences, the models shared a striking set of biases. The models tended to generate too many MCSs, especially short-lived ones. They also made storms too small in area and too intense in rainfall rate. This meant the rain was packed into cores that were stronger and more concentrated than satellite observations showed.
“They produce too many MCSs, which are too short-lived, too small in area, and too intense in rainfall rate.” said Dr. Puxi Li, corresponding author of the study.
The team also found that nearly all the models overestimated stronger rainfall and underestimated the area covered by that rain. In simpler terms, the storms often looked too compact and too violent.
That shared pattern is important because it points to a common weakness in today’s kilometer-scale modeling, not just a flaw in one system. The findings suggest that even as global models improve dramatically, they still struggle with the internal structure of convective storms.
The study also showed that the models generally underestimated the overall magnitude of MCS precipitation, even when they captured the right locations and timing. So the simulations often knew where the storm belts should be. However, they did not know exactly how much rain they should unload, or how broadly it should spread.
One model stood apart for a different reason. The UK Met Office model, UM, kept deep and shallow convection parameterizations active, unlike most of the others. Instead of producing overly intense, compact rainfall, it showed almost the opposite tendency in some cases. That is, with weaker rainfall intensity and broader precipitation or cloud area, especially over the ocean.
That contrast highlights a larger debate in climate modeling. Once models reach kilometer-scale resolution, should convection schemes be switched off? Or should they be revised and retuned to still operate at that scale? The new results do not settle that argument, but they sharpen it.
The authors were also careful not to oversell what one season can prove. Their analysis focused on a single extreme summer, not every region or every kind of storm. Even so, the fact that several models captured the main MCS rainfall centers without being nudged through day-to-day observed weather suggests that large-scale background conditions still anchor where extreme summer storm activity tends to organize.
East Asia is not a casual proving ground for storm simulations. MCSs contribute roughly 40% to 50% of total warm-season rainfall there, according to the study’s background review. They are tied to many of the region’s heaviest rain events.
The urgency has only grown. The researchers noted that in late May 2026, extreme rainfall struck the middle and lower Yangtze River basin. This prompted China’s Ministry of Water Resources and the China Meteorological Administration to issue the year’s first national-level Red Alert for torrential rain and flash floods.
The same research group has also reported that MCS-related rainfall has grown more frequent and intense over the East Asian summer monsoon rainband in the past two decades. It has contributed more than 75% of the total precipitation increase there.
That helps explain why kilometer-scale Earth system modeling is drawing so much attention. These simulations are no longer just technical showpieces. They are becoming tools that could shape flood preparedness, infrastructure planning, and climate adaptation.
The study suggests that global kilometer-scale models are reaching a meaningful threshold. They can now capture much of the geography, timing, and movement of the storm systems behind some of East Asia’s worst summer rainfall. That is a major step beyond older coarse models.
At the same time, the shared biases show where improvement is still needed. If models keep producing storms that are too frequent, too compact, and too intense, then forecasts of flood risk and future climate hazards could still be distorted in important ways.
The clearest path forward is not simply more computing power. Instead, the authors point to better cloud microphysics, boundary-layer mixing, and tighter coupling among atmosphere, ocean, and land processes. If those upgrades work, the payoff could be practical: better early warning, better disaster planning, and a clearer picture of how warming will reshape extreme rainfall.
Research findings are available online in the journal Advances in Atmospheric Sciences.
The original story “50-megapixel Earth models view storm weather in unprecedented detail” is published in The Brighter Side of News.
Like these kind of feel good stories? Get The Brighter Side of News’ newsletter.
The post 50-megapixel Earth models view storm weather in unprecedented detail appeared first on The Brighter Side of News.


Leave a comment
You must be logged in to post a comment.